



Survival Analysis Explained: Kaplan-Meier, Cox Models and Turnover
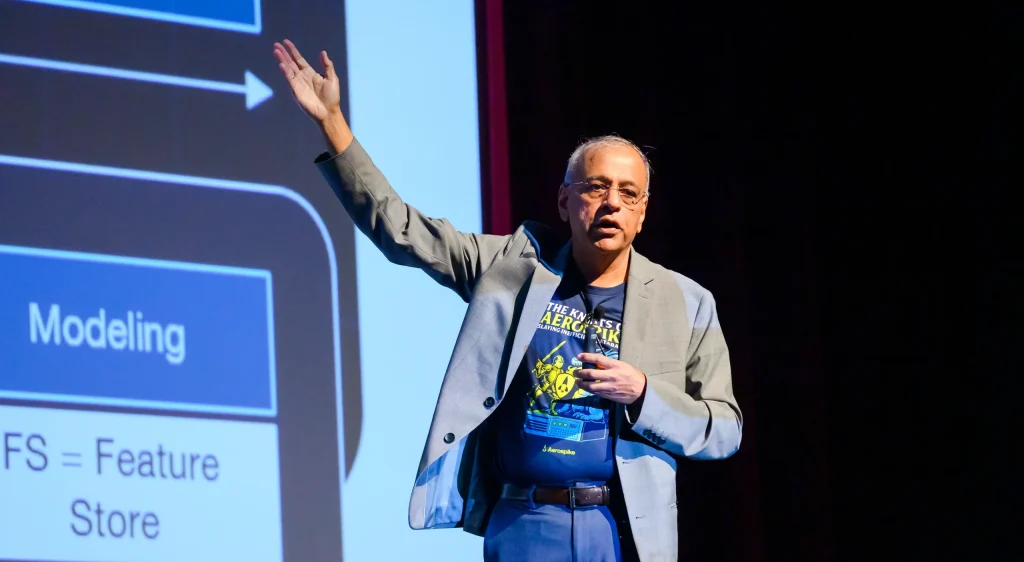
In a session at the Data Science Innovators Conference 2023, KPMG data scientist Alexander Baker explained survival analysis, from censored data to Kaplan-Meier curves and Cox models. He closed with a Python demo predicting employee turnover.
By The AI Enterprise Magazine Team4 min read

Key takeaways
- Time to event. Survival analysis models how long an entity stays in a system before an event such as attrition or failure.
- Censoring is the point. Entities without an event yet still carry information, and survival methods are built to use it.
- Two core curves. Kaplan-Meier estimates survival probability; Nelson-Aalen estimates cumulative hazard.
- Extrapolate with parametric models. Fitting Weibull-type distributions lets analysts forecast beyond the observed window.
- Add attributes with Cox models. Hazard ratios show how covariates raise or lower risk, for example of employee turnover.
Survival analysis is a corner of statistics that, in the words of KPMG data scientist Alexander Baker, has "always kind of flown underneath the radar." In a roughly hour-long session at the Data Science Innovators Conference 2023, "Surviving Survival Analysis," Baker explained the method, its core curves and models, and a hands-on Python demo using employee turnover data.
Baker said he has applied the technique while working at KPMG and Booz Allen on projects for clients including the FDA, the Air Force and the Department of Homeland Security. He called it especially useful for human resources problems and for experiments.
What is survival analysis?
Survival analysis models how long an entity spends in a system before a particular event occurs, Baker said. The entity can be a cell, an employee or a machine, and the event can be cell death, resignation or equipment failure.
Setting up an analysis means defining the system, an observation period, the event, an entry point and a discrete time unit. The time unit should suit stakeholders: for turnover, years or months are more useful than minutes. Each entity's timeline runs from entry to either the event or the end of the observation period.
Why does censored data matter?
Entities that reach the end of the observation period without the event are called censored. In a turnover study, employees who have not left yet are censored, Baker explained.
"Censoring occurs when an event is unknown," he said, calling it the reason survival analysis exists. Survival methods are built to use these partial records, which he said is why traditional machine learning methods struggle with this kind of data.
Baker described three types:
- Right censoring, the most common: the event has not happened by the end of the period.
- Left censoring: the event happened before the observation period began. Options include dropping those records or extending the period back, which can add some bias.
- Interval censoring: the event is known to fall within an interval but not the exact time. He pointed to the Turnbull approximator and bounding intervals as approaches, adding "there is no right answer" and that statisticians debate it.
How do Kaplan-Meier and hazard curves work?
The Kaplan-Meier curve estimates the share of a population still surviving at each point in time. At each event time, it multiplies the previous value by the ratio of unaffected individuals to those at risk. A censored entity leaves the at-risk count without causing a drop.
Baker worked through a toy example with ten cells. Two die at time two, dropping the curve to 0.8. A censored cell then leaves, so a later drop of two cells is calculated out of seven at risk, not eight. The curve ends at zero when the last three die at time ten.
The Nelson-Aalen estimator is the hazard counterpart. It sums the ratios of events to at-risk individuals, giving the cumulative rate at which events occur. In his example, the cumulative hazard climbs past 1.4 by the end.
How can survival models predict beyond the data?
Nonparametric curves cannot extrapolate. A curve that ends at zero says nothing about survival past the observed window. Parametric methods fit distributions such as the Weibull to the curves so analysts can forecast further out and reduce the bias from limited early data.
To compare groups, Baker recommended the log-rank test, which he described as a modified chi-square test. Its null hypothesis is that two survival curves come from the same population.
How do you add employee attributes to a model?
The Cox proportional hazards model lets covariates such as vacation benefits, job level or satisfaction shift an entity's hazard relative to a baseline. Exponentiating a coefficient gives a hazard ratio: below one means lower risk, above one means higher risk. Baker noted the model is fit by minimizing the negative log partial likelihood, which is how it accounts for censoring.
Its parametric counterpart, the accelerated failure time model, forecasts survival probabilities and hazard rates for individuals based on their attributes. For next steps, he pointed to survival trees, survival forests, survival support vector machines and deep learning, and to the Python libraries lifelines for the basics and PySurvival for advanced methods.
What did the turnover demo show?
Using lifelines, Baker first fit a toy data set and then an employee turnover data set from Kaggle. He selected variables that do not change over time, since the Cox model assumes features are time-independent, and fit Kaplan-Meier, Nelson-Aalen, Weibull and Cox models.
More people tended to leave earlier than later, he said, and the log-rank test showed no significant difference between male and female groups in that example. He closed by showing a simple Streamlit dashboard that predicts an employee's survival probability from their attributes, and said he would share the code.
Where to keep learning
AI Connect's 2027 webinar schedule includes 24 free live sessions across four series, from AI × Enterprise panels to hands-on demos. Browse the lineup at /webinars/; registration for 2027 events is coming soon.
Frequently asked questions
What is survival analysis?
Baker described it as modeling the time an entity spends in a system before a particular event occurs, such as an employee leaving or a machine failing.
What is censored data in survival analysis?
Censored data are entities for which the event has not occurred (or its timing is unknown) within the observation period, such as employees who have not yet left.
What is the difference between a survival curve and a hazard curve?
A Kaplan-Meier survival curve shows the probability of surviving past a time; a Nelson-Aalen hazard curve shows the cumulative rate at which events occur.
What does the Cox proportional hazards model do?
It adds covariates to a survival model; exponentiated coefficients give hazard ratios, where below one means lower risk and above one means higher risk.
This article is based on remarks by Alexander Baker, Data Scientist, KPMG at Data Science Innovators Conference 2023 on April 12, 2023. More coverage: More AI Connect Events.
Filed under: AI Use Cases & Applications, People, Culture & Leadership