

Introduction to Analytics: Data Types, Distributions and Charts
At the 2024 AI Connect K-12 Data Science Conference, Alexander Baker of CBeyonData introduced analytics to students. He covered categorical and numerical data, describing distributions, why outliers matter, and choosing among bar charts, scatter plots, histograms, box plots and line charts.
By The AI Enterprise Magazine Team3 min read

Key takeaways
- Know your data type. Categorical versus numerical determines which tools and charts apply.
- Center and spread. Look at spread, not just the mean.
- Watch outliers. They can distort analysis and often come from entry errors or faulty equipment.
- Match chart to question. Bar charts for categories, scatter plots for relationships, line charts for time.
- Next steps. Python and SQL for preprocessing, dashboard tools for reporting.
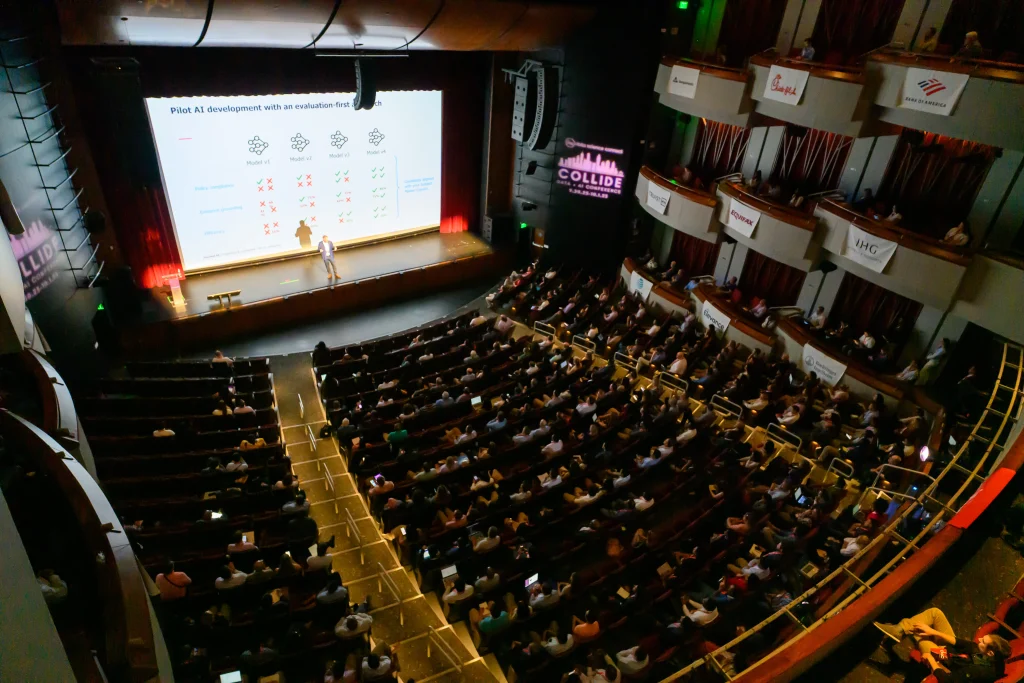
At the 2024 AI Connect K-12 Data Science Conference, a virtual event, Alexander Baker, Senior Data Scientist and Engineer at CBeyonData, gave students an introduction to analytics: what kinds of data they will meet, how to describe a distribution, and which chart fits which question.
Baker opened by arguing that data is "a very important asset to any company you could possibly think of." Companies have embraced big data in recent years to gain an edge over competitors, he said, once they realized their information could do more than support taxes and administration.
Why does data analytics matter?
Baker pointed to a Washington Post image on his slides that called Barack Obama the "Big Data president" because of the 2008 campaign's use of data. His point was that data is used at the highest levels of politics, business and stock trading. He also described data as a multi-billion-dollar industry.
What types of data will you encounter?
The first question to ask of any data set, Baker said, is whether it is categorical or numerical, which scientists sometimes call qualitative or quantitative. The answer matters because it changes which analytical tools are available. Numerical data, for example, can be plotted in different ways than categorical data.
He broke the types down further:
- Categorical data can be ordered or unordered. Shirt sizes, or Starbucks' tall, grande and venti, are ordinal: you know there is an order even if the categories are vague.
- Discrete data takes only certain values, such as whole-number points on a test. Continuous data can take unlimited values.
- Interval and ratio scales differ in whether zero is meaningful. Baker acknowledged that the classification of some scales, such as height, is debated.
- Analysts should also consider whether a variable changes over time or is a snapshot of a single point.
He suggested a variable-type diagram that splits variables into categorical (nominal and ordinal) and numerical (discrete and continuous, with continuous split into interval and ratio).
How do you describe a distribution?
Baker described a variable as the values data can take and a distribution as all the values available for it. He said he defaults to the mean and standard deviation, which tell you the center of a distribution and the spread around it.
His example was student heights. If the average is about five feet, the question is how many students cluster there and how many fall in the four-foot or six-foot ranges. A wider spread means a variable can take more values, so he advised looking at spread whenever you look at the center.
Other measures he covered were percentiles, the median (the 50th percentile), and the minimum and maximum values. He defined an outlier as a value far from the rest, such as a person eight to ten feet tall in a height data set.
Outliers matter, Baker said, because "they can mess up your analysis, they can mess up your statistical testing." Many come from poor data entry or a bug in recording software. His example was a temperature sensor in a temperate climate reporting 300 degrees Fahrenheit, which would point to an equipment problem.
Which chart should you use?
Baker said visualization is an effective way to tell a story with data, and that data type determines which chart works best:
- Bar and multi-bar charts suit categorical data, usually showing how often each category appears.
- Scatter plots show relationships between numerical variables. His example plotted wind speed against temperature and showed a downward trend.
- Histograms and box plots show how values are distributed, including spread, skew and outliers.
- Line charts show a numerical variable over time. He cited stock market charts such as the S&P 500, and an example of sales across years.
What should beginners learn next?
For next steps, Baker recommended Python and SQL for preprocessing data, and Tableau, Microsoft tools and Power BI for dashboards. Data science, he said, goes further by using predictive analytics to extract actionable insights, and it builds on the analytical concepts he covered.
Where to hear more
AI Connect continues to run free live sessions on data and AI. The 2027 schedule includes 24 free live webinars across four series: the AI x Enterprise Panel Series, AI Demo Days, Agentic AI Showcases and the Plug & Play Series. Registration for 2027 events is coming soon. See the webinar schedule.
Frequently asked questions
What are the main types of data?
Baker split data into categorical (nominal and ordinal) and numerical (discrete and continuous, with continuous divided into interval and ratio).
What is an outlier and why does it matter?
It is a value far from the rest. Baker said outliers can distort analysis and statistical testing and often stem from data-entry errors or recording bugs.
Which chart should you use?
Bar charts suit categorical data, scatter plots show relationships between numerical variables, histograms and box plots show distributions, and line charts show change over time.
What tools should beginners learn next?
Baker recommended Python and SQL for preprocessing and Tableau, Microsoft tools and Power BI for dashboards.
This article is based on remarks by Alexander Baker, Senior Data Scientist and Engineer, CBeyonData at AI Connect K-12 Data Science Conference 2024 on July 25, 2024. More coverage: More AI Connect Events.
Filed under: AI Use Cases & Applications, People, Culture & Leadership